Content of this Document
The purpose of this document is to detail the Statistics module inside ChopChop3D Slicer:Introduction
We think the following quote from H. James Harrington describes perfectly why we need those statistics: Measurement is the first step that leads to control and eventually to improvement. If you can’t measure something, you can’t understand it. If you can’t understand it, you can’t control it. If you can’t control it, you can’t improve it.
Once the slicer has finished its job we gather all those statistics to give you what and where it is taking time and consuming filament. Those statistics are available through the Menu Slicer/Dialogs/Statistics
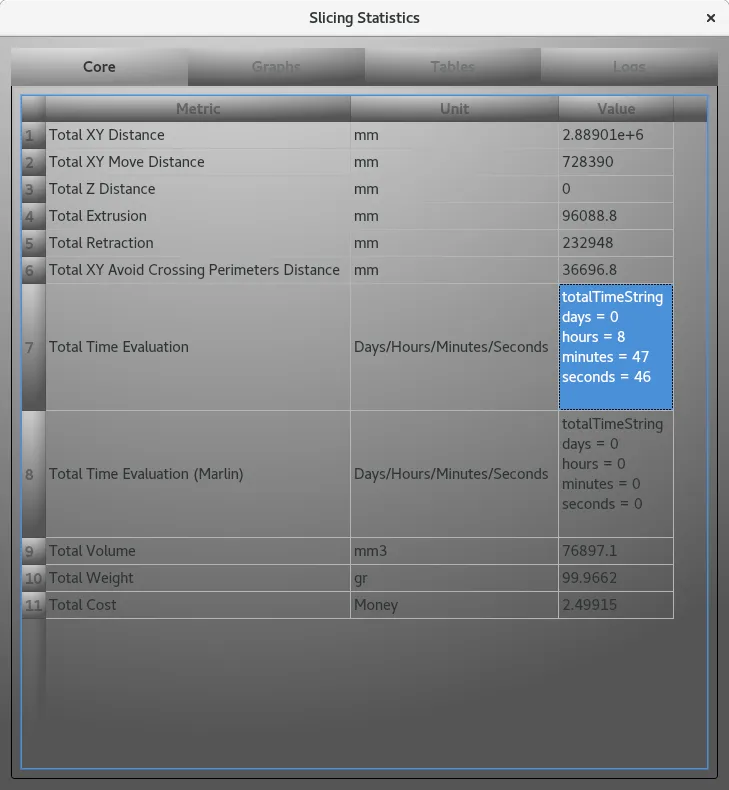
Core
The Core tab contains the main statistics:
- how many print moves ?
- how much filament ?
- how much time ?
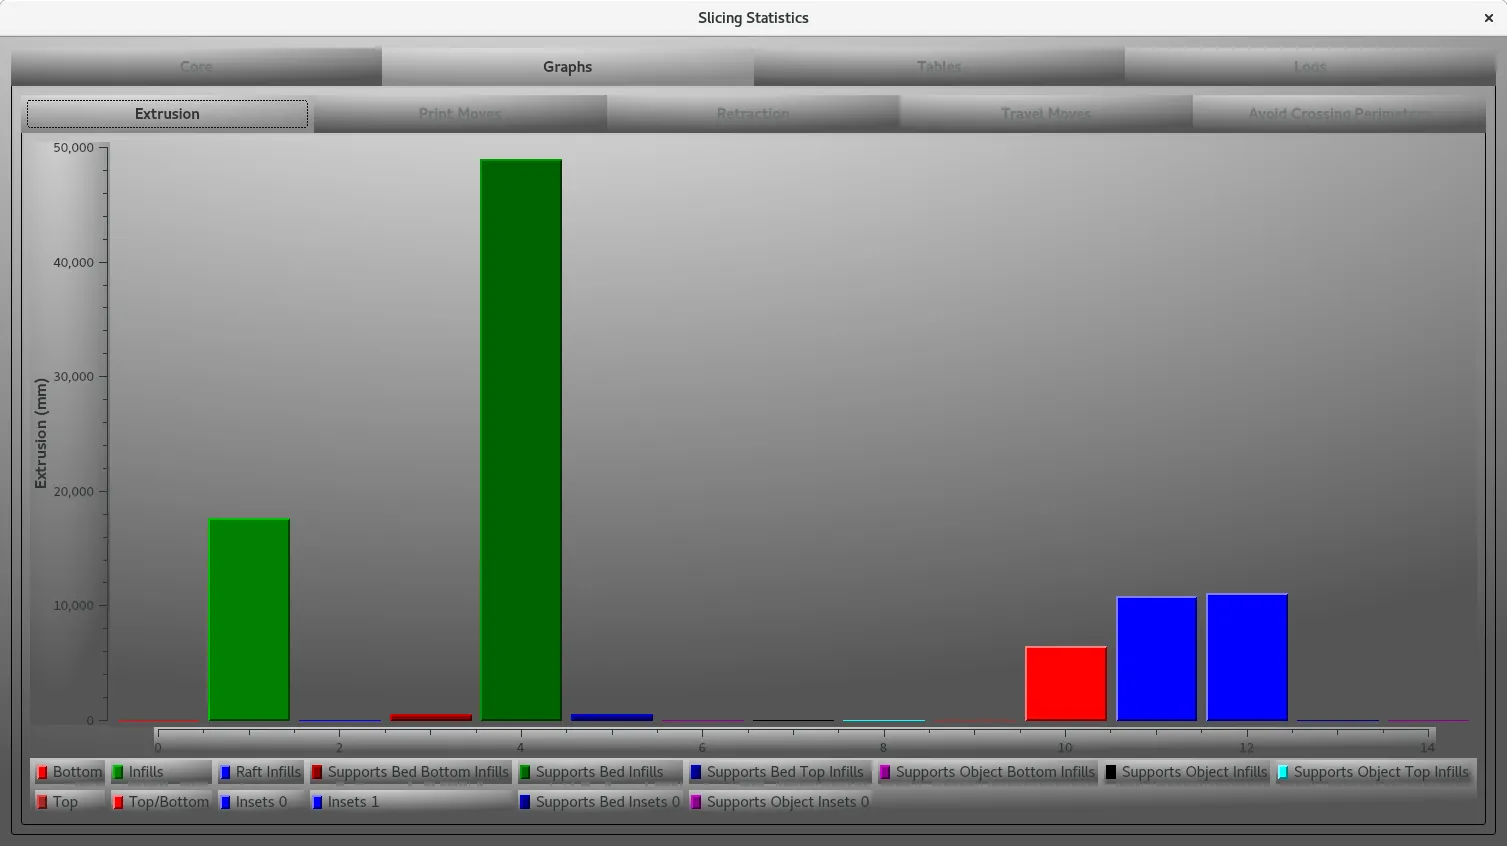
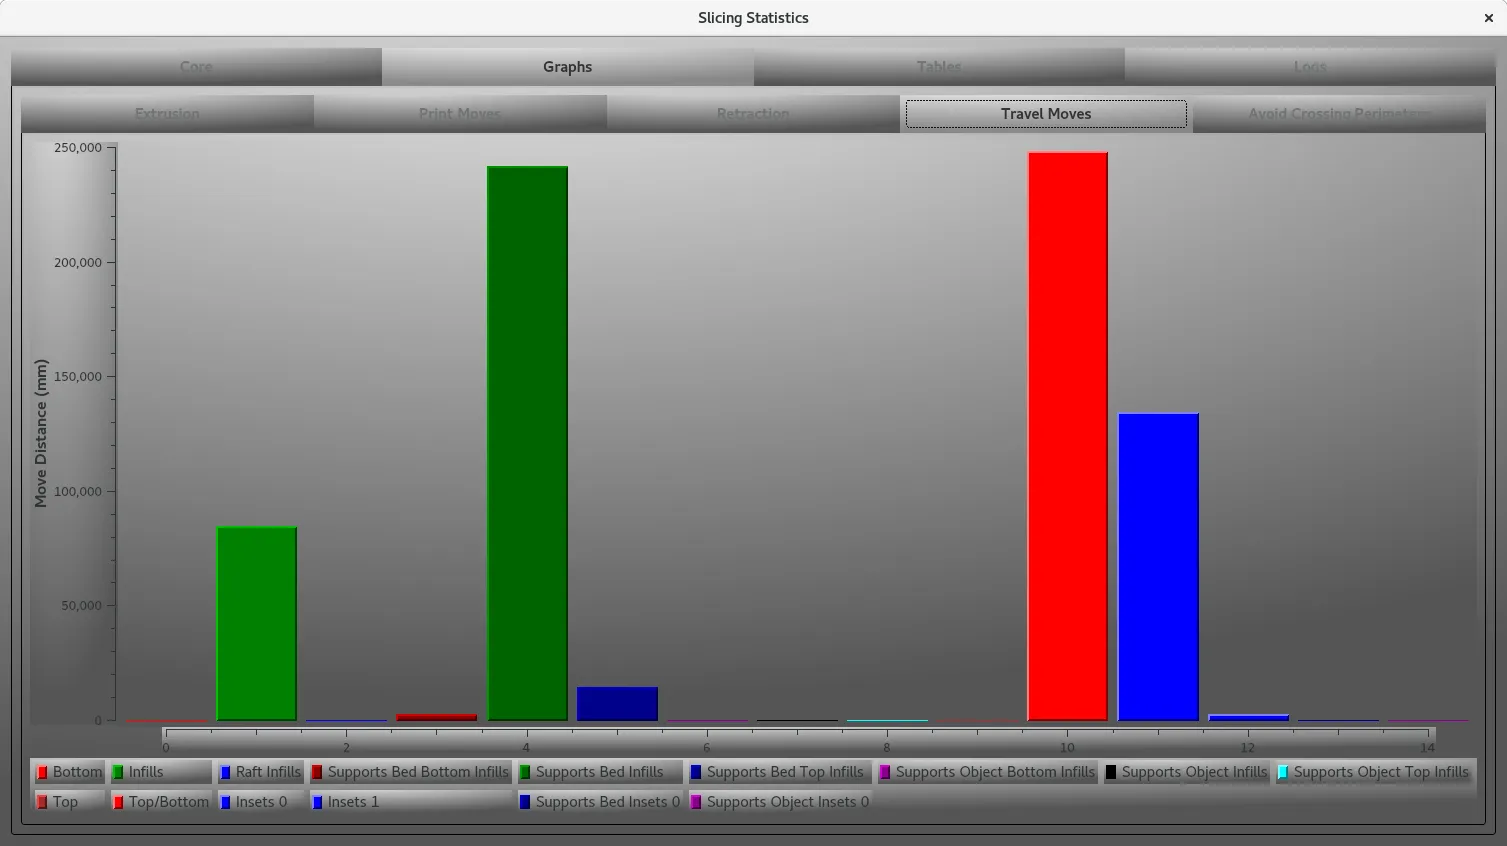
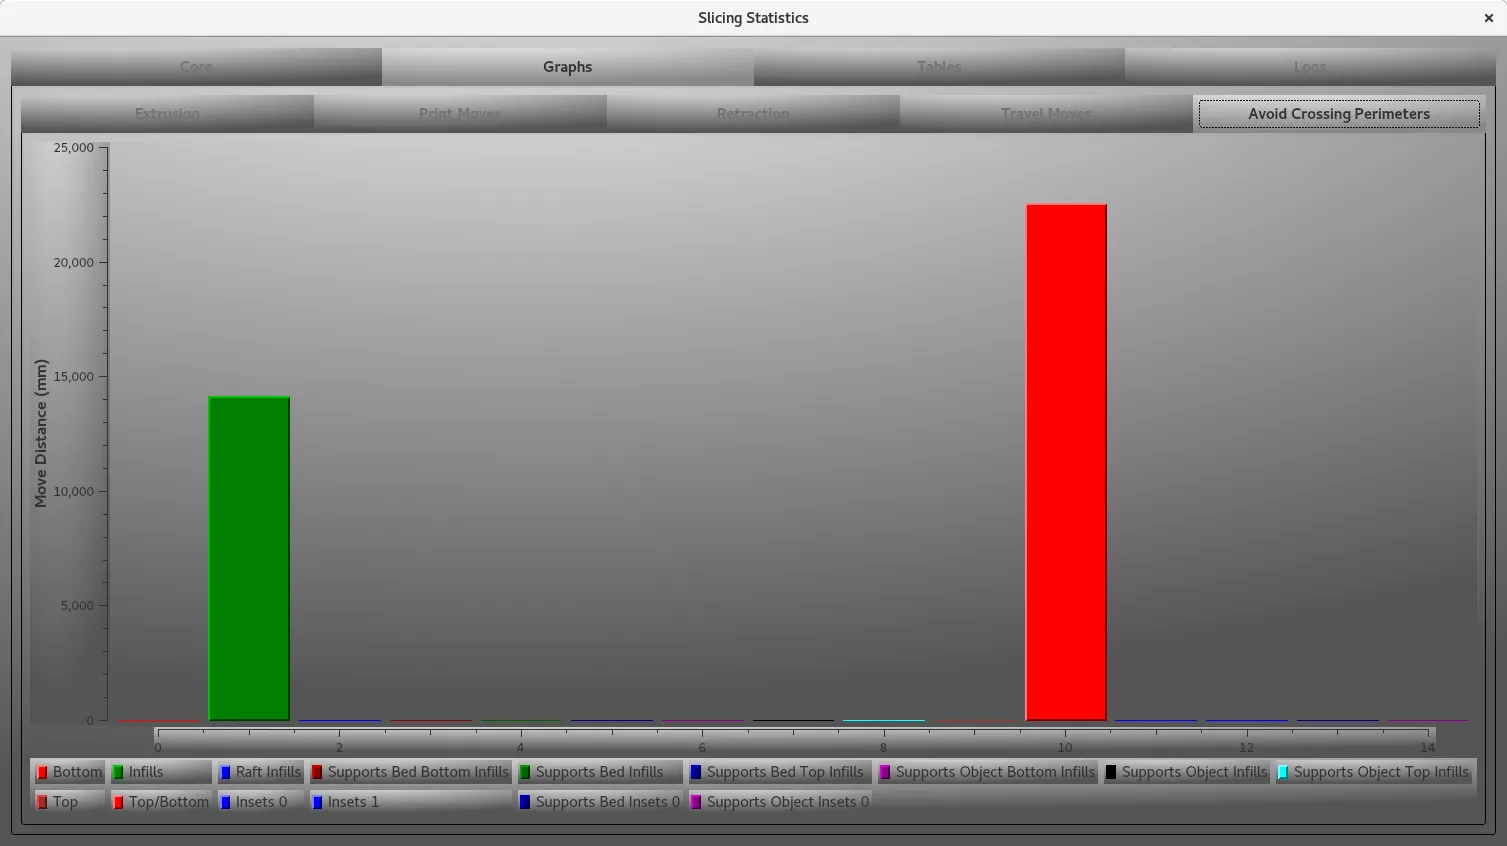
Graphs
The Graphs tab contains various graphs showing usage for each printing phase for :
- Extrusion
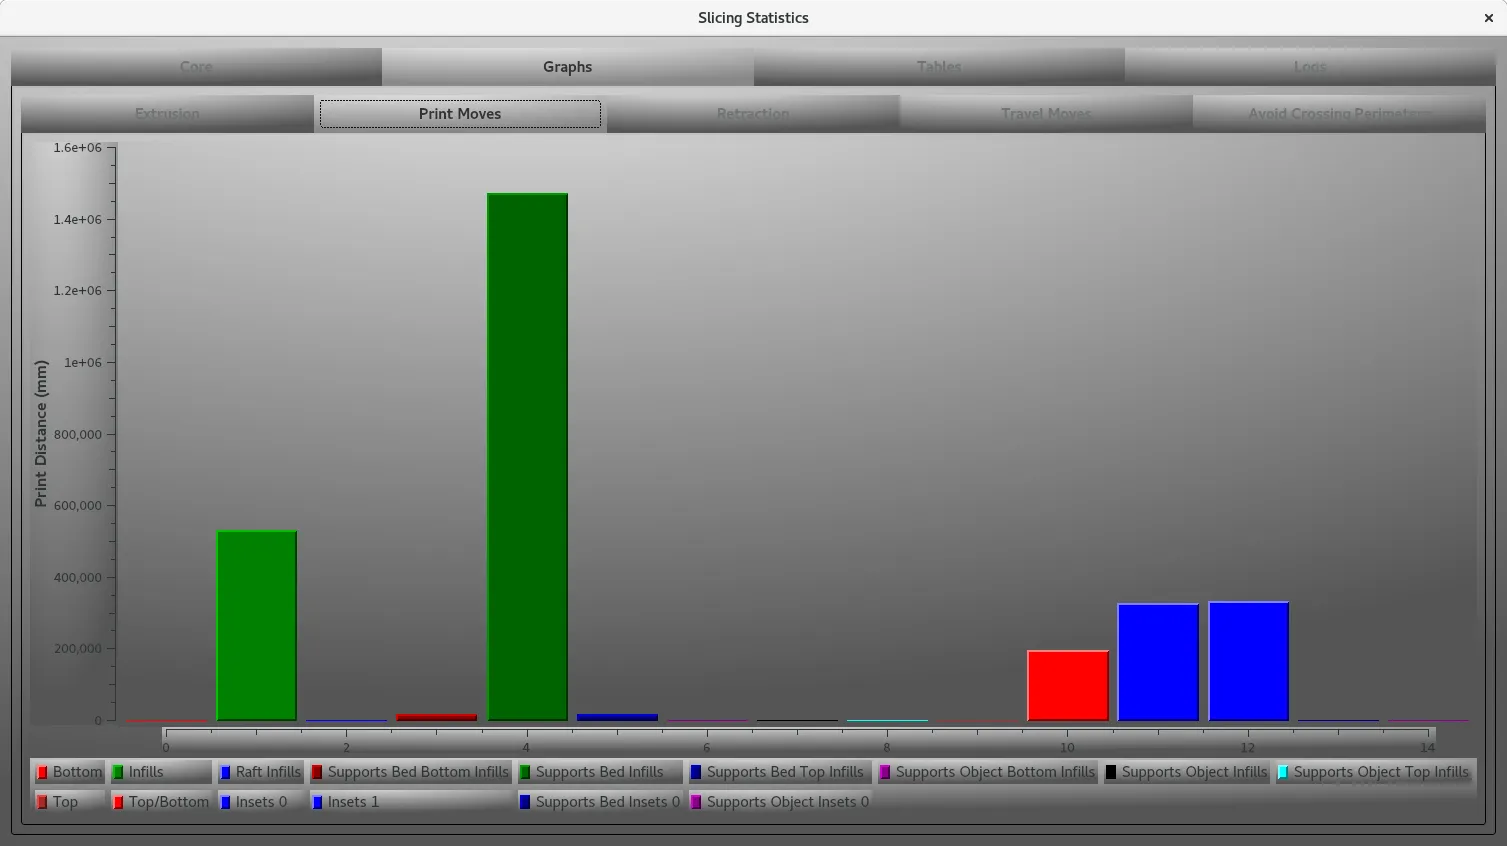
- Print Moves
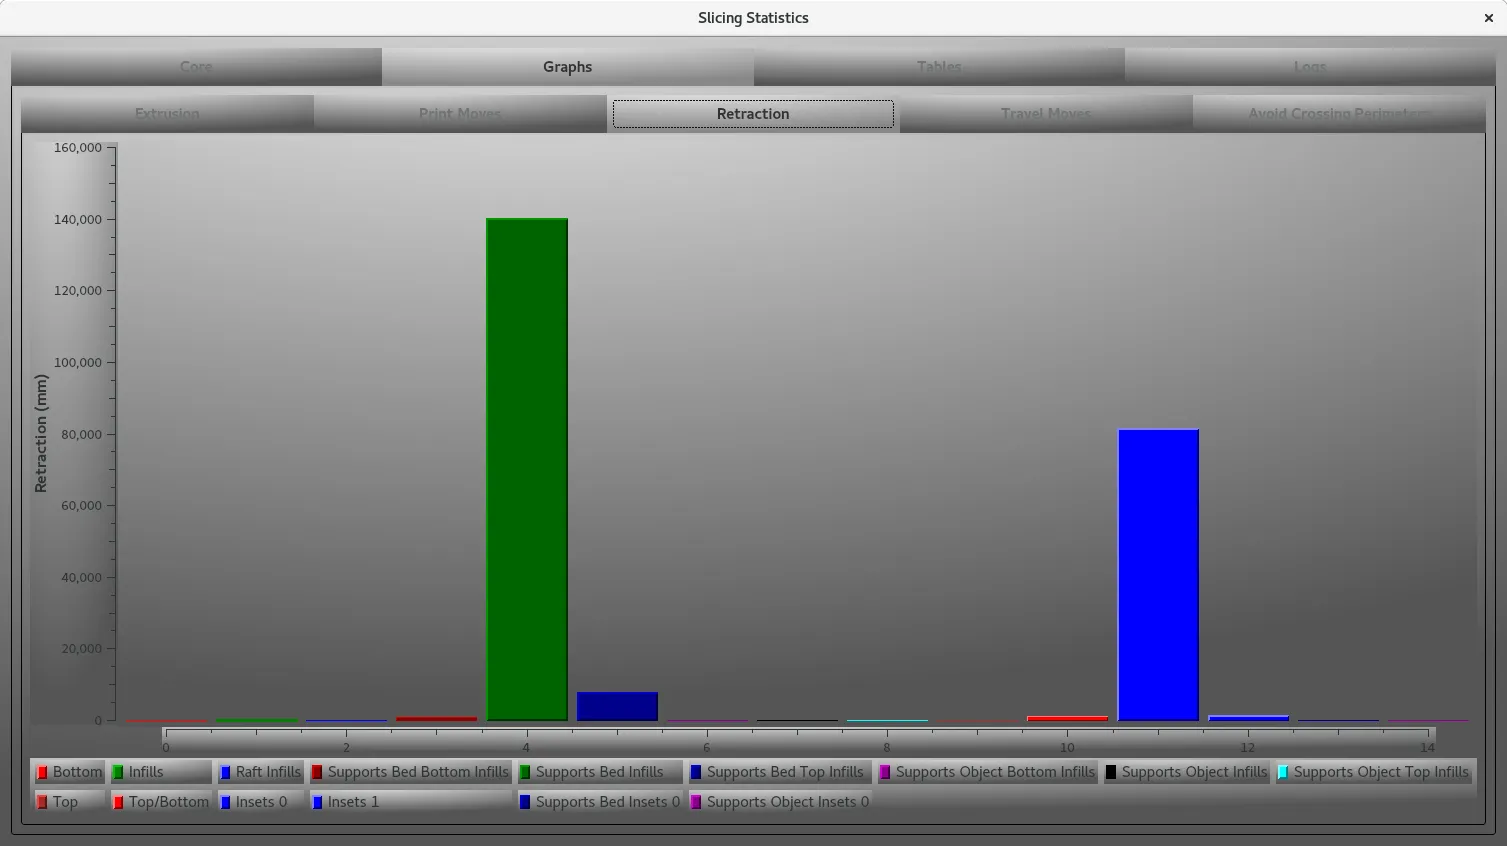
- Retraction
- Travel Moves
- Avoid Crossing Perimeters
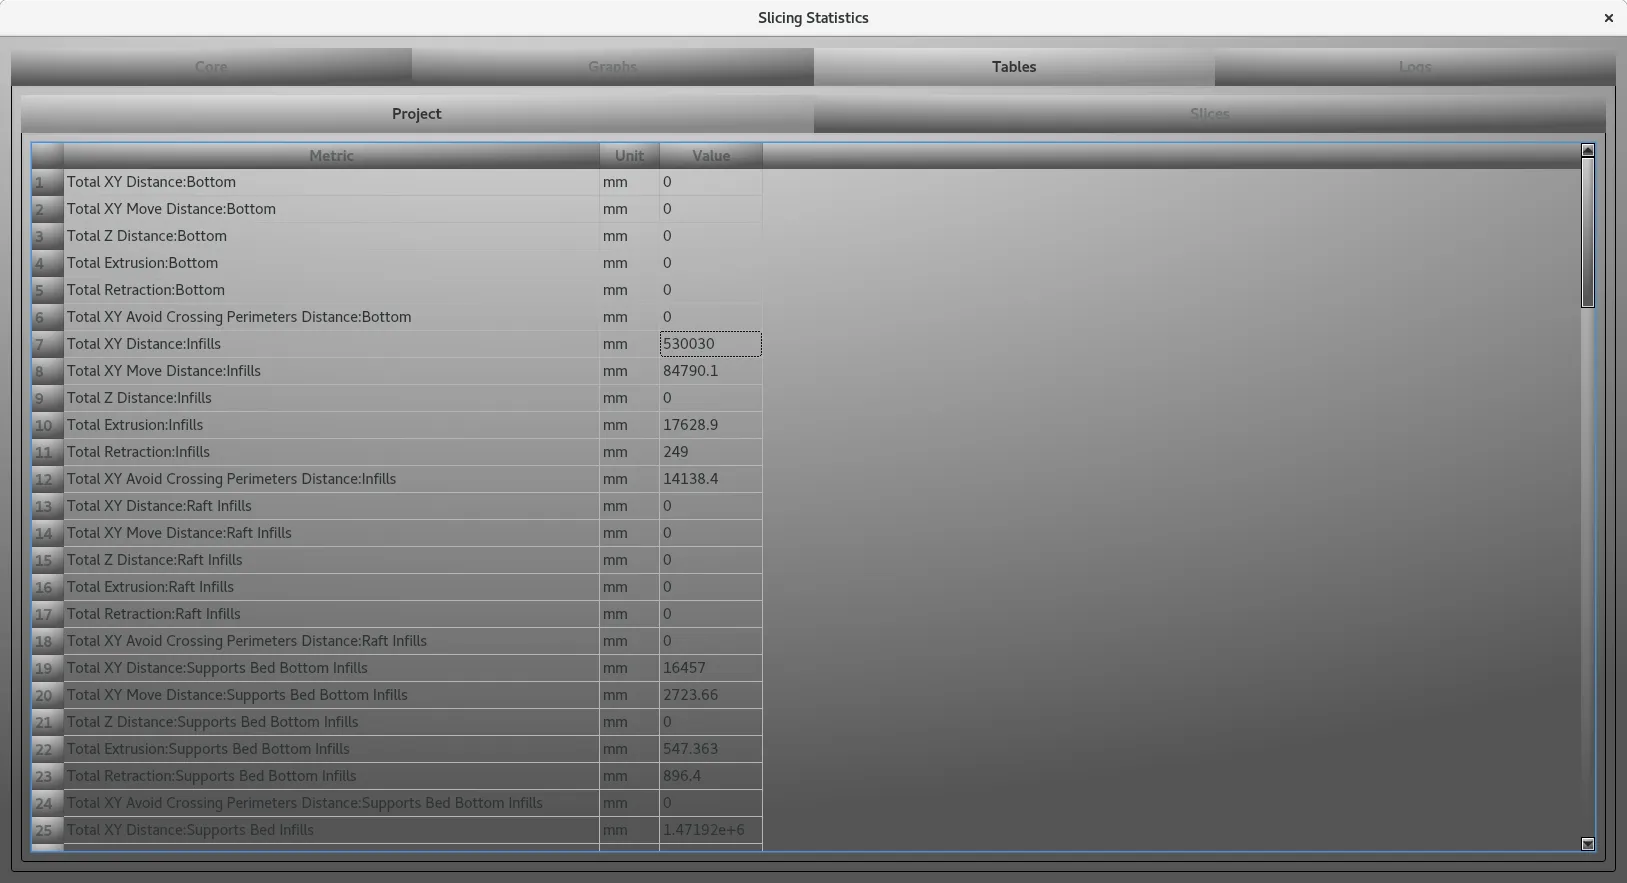
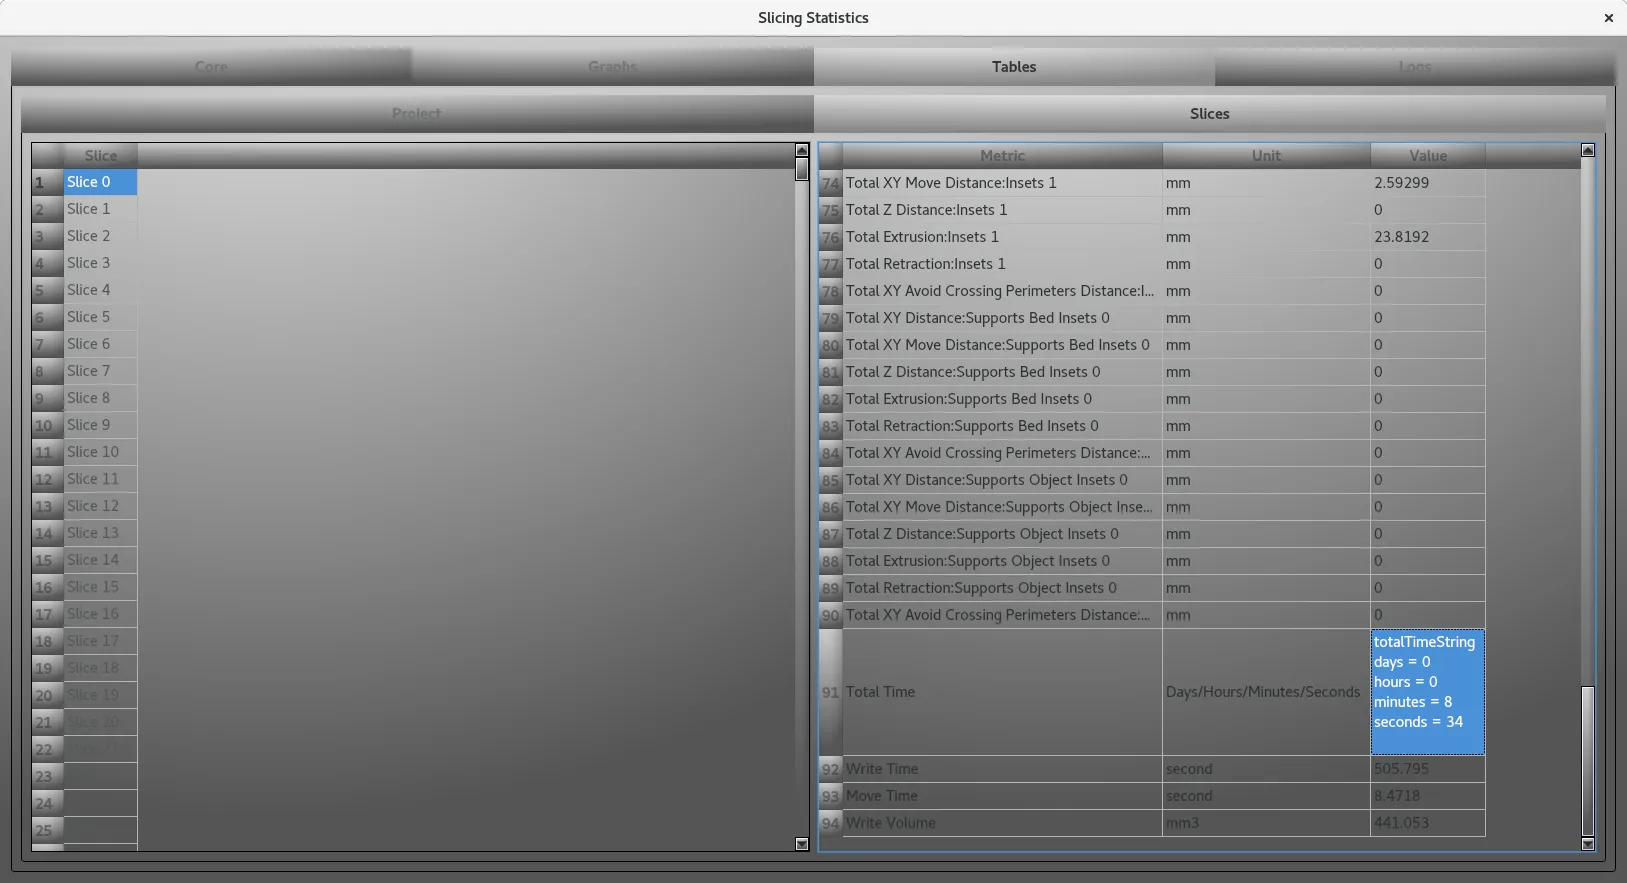
Tables
The Tables tab is providing the detailed numbers used to draw the Graphs, there are aggregated values of all the slices in the Project tab, and you have also all the details for each slice in the Slice tab.
Logs
The Logs tab is used to check the performances of the slicer, the different slicing phases are measured. So, we can spot quickly any issue.